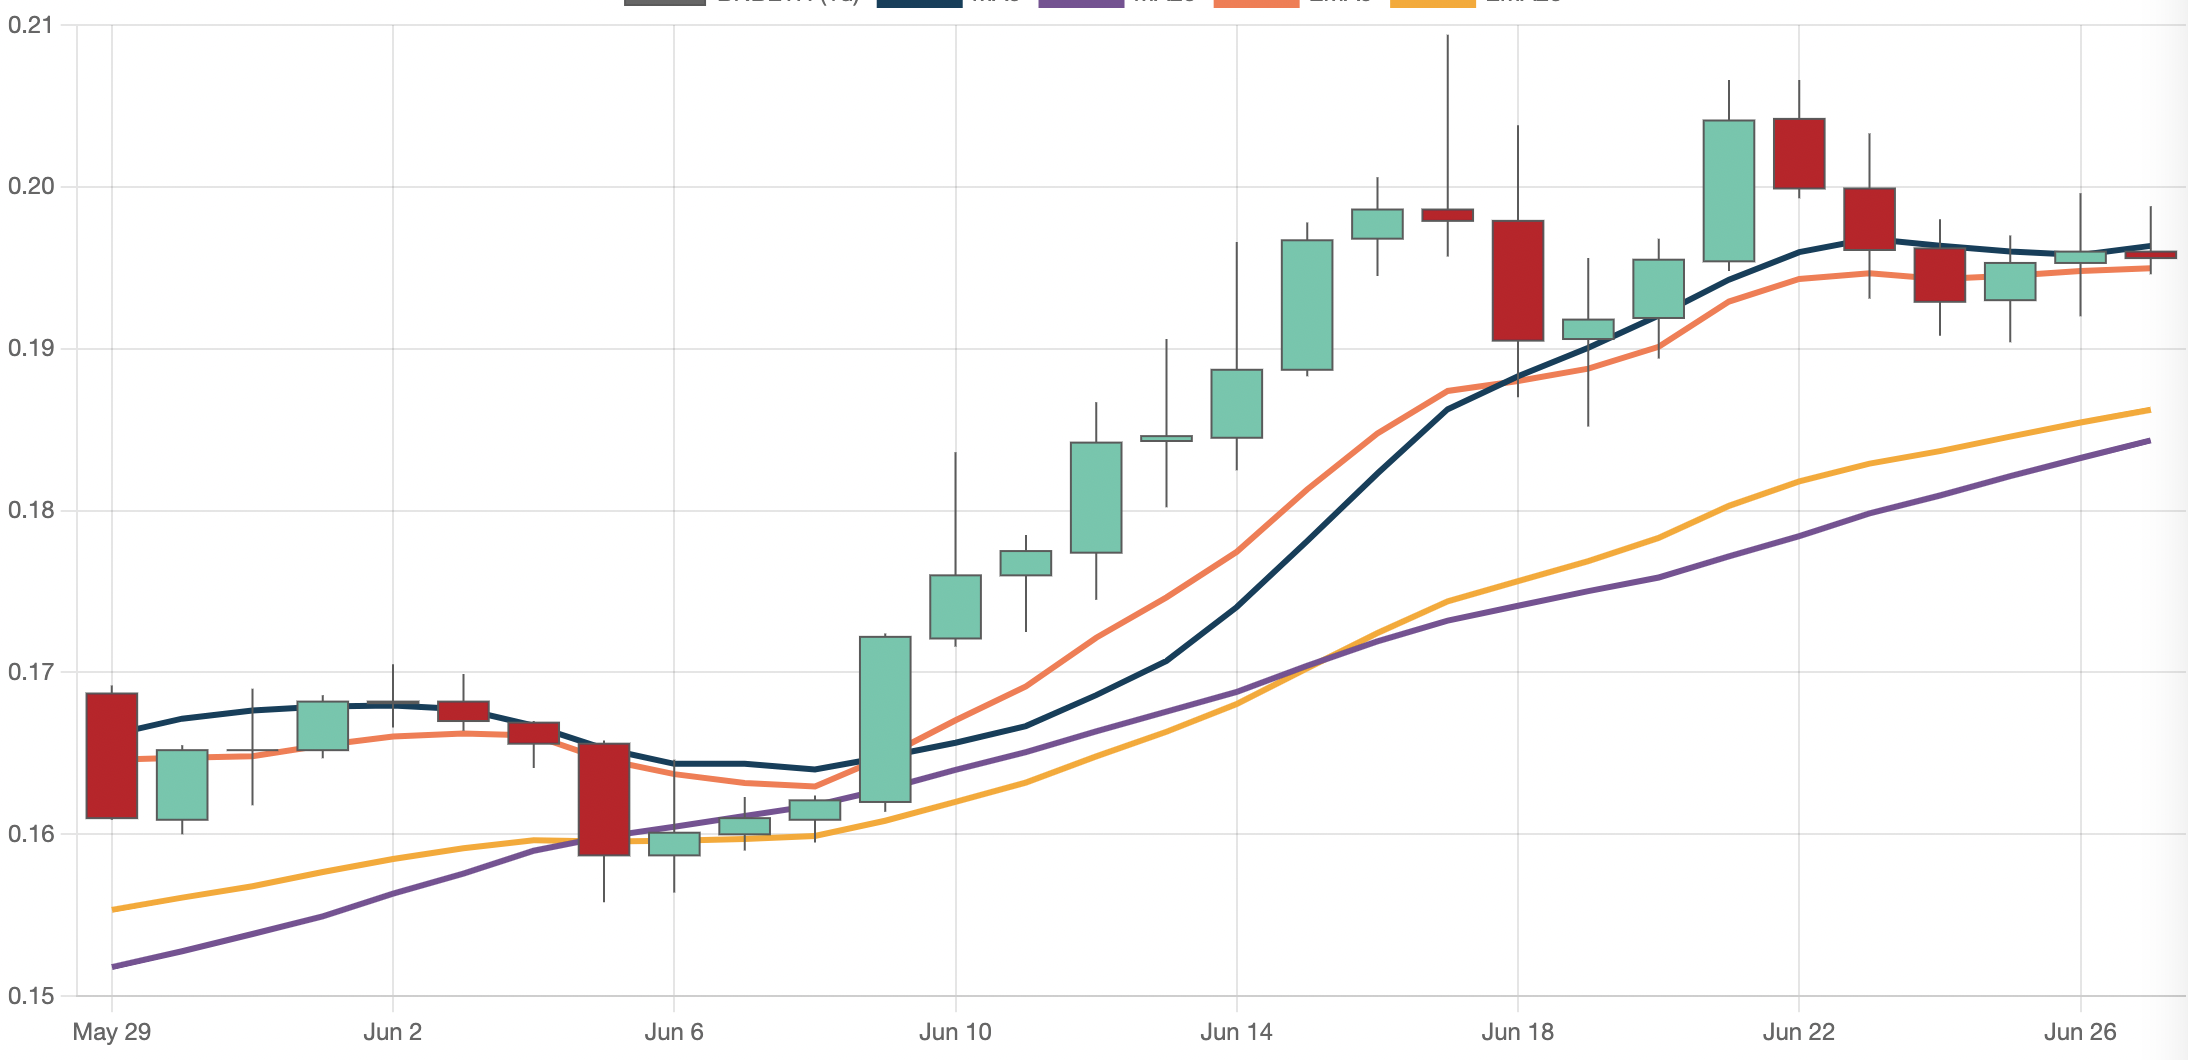
This post shares the steps I took to include Chart.js with candlestick charts (using a plugin) on my weekend/pet project. I’m using webpack to bundle its JavaScript code & dependencies.
I’m trying to write this in a framework agnostic way, but the fact is I’m using webpack in a Ruby on Rails app (via jsbundling-rails), so there will be some specifics that may differ from someone else’s approach.
Install
I’m using the chartjs-chart-financial plugin so, first step is to install Chart.js and all necessary dependencies.
yarn add chart.js luxon chartjs-adapter-luxon chartjs-chart-financial
Note: If you’re using React or Vue there’s a good chance you’ll be better off installing and using a React wrapper or Vue wrapper.
Initialize
Add this to application.js (or similar entrypoint to the app).
import Chart from 'chart.js/auto'
import * as luxon from 'chartjs-adapter-luxon'
import * as finChart from 'chartjs-chart-financial'

// Register the plugin's custom controllers
Chart.register(finChart.CandlestickController, finChart.CandlestickElement)

// Ensure the Chart class is loaded in the global context
window.Chart = Chart
Usage
I’m on Rails and using Hotwire, so my JavaScript code lives in Stimulus controllers.
I can use the Chart class from a connect() method in my controller because it was loaded globally. Each page visit includes the controller and the chart’s data it needs in the HTML itself.
// `this.canvasTarget` references the Chart.js canvas HTML element
// this might differ depending on your framework (or lack thereof)
var ctx = this.canvasTarget.getContext('2d')

// `this.dataTarget` references the JSON data embedded in the HMTL
var data = JSON.parse(this.dataTarget.innerHTML)

// Traditional Chart.js usage but with a plugin's custom Chart type
var myChart = new Chart(ctx, {
  type: 'candlestick',
  data: {
    datasets: [ ... ] // <- data goes here
  },
  options: { ... }
})
Official docs here for Chart.js specifics
That’s it
With some data and options added to the chart you’re all set. The example below has line charts overlayed with the Candlestick chart.

Architectural choices & tradeoffs (RoR specific)
Embedding a large-ish JSON dataset in the HTML, times the number of charts in each page makes the HTTP response sizes larger than with an alternative approach (i.e. async API request). This problem likely increases the perceived response times, more so in slower connections.
Concious of this performance penalty I decomposed the charts in separate endpoints using lazy loaded frames.
This is also nifty for caching purposes since the chart’s dataset is cached with (inside) the HTML response itself. Chart.js is initialized only once in the app’s lifetime and is ready to use as soon as the controller renders on screen, ideally via cached network request.
Kudos
I found help and inspiration in @wanderingsoul’s Chart.js post, Chart.js/Hotwire’s docs, the plugin’s GitHub docs, and lots of trial & error 🙃
Pura vida.